Random Forest Pattern Engine
The ApexTrend RF system evaluates market behavior using an ensemble model (Random Forest) trained on historical trade snapshots. It recognizes recurring technical contexts that historically aligned with favorable follow-through in backtests.
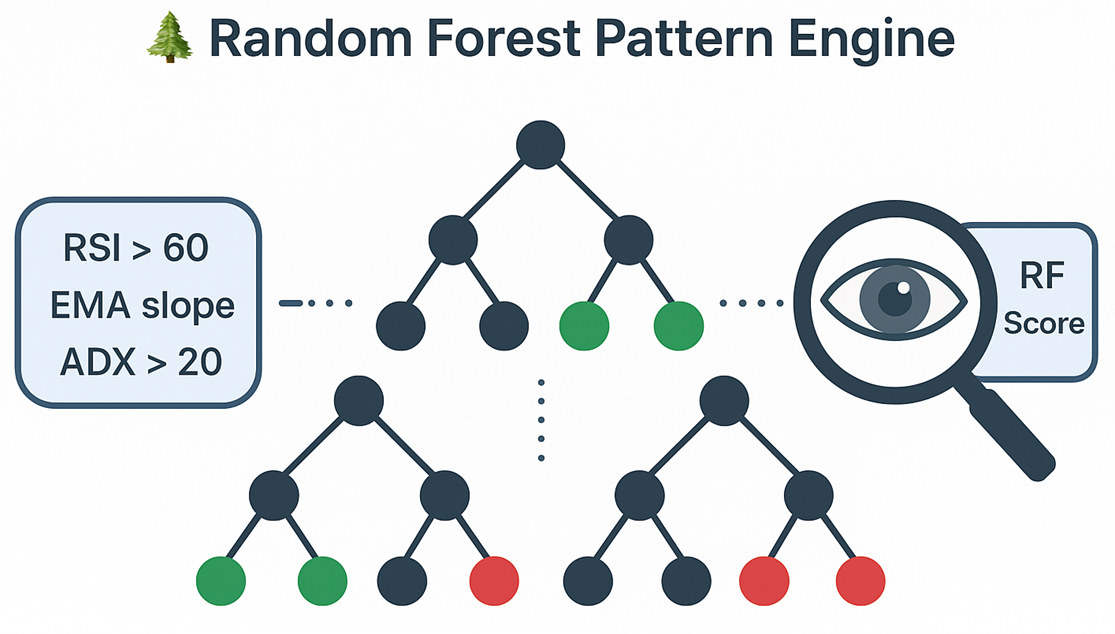
When you select a symbol, ApexTrend computes a feature vector (RSI, EMA slopes, ADX, MACD, candle shape, volume context, etc.), evaluates it across many trees, and returns a 1–10 setup rating in real time.
How Random Forest Works
A Random Forest is a collection of decision trees. Each tree splits data on rules such as:
- RSI above a threshold
- EMA50 slope positive
- ADX within a momentum range
Each tree “votes” based on similar historical contexts; the forest aggregates those votes into a single score.
How It’s Queried
On symbol selection, the workflow is:
- Collect current indicators (RSI, EMA slopes, MACD, ADX, candle features, volume context, VWAP distance, etc.).
- Convert them into a normalized feature vector.
- Evaluate across the forest; aggregate the votes.
- Return a 1–10 setup rating to aid research.
The score is designed to be an input to your process not a prediction or guarantee.
How It Learns: The Trade Fingerprint
Each trade snapshot is logged with a multi-feature fingerprint: price/volume context, ~17 continuous indicators (e.g., RSI, ADX, EMA slopes, MACD, VWAP distance), and a set of Boolean pattern flags. The RF learns combinations of these features that, in backtests, aligned with stronger follow-through.
- Every record includes entry time, outcome label (backtest), and the full indicator state at entry.
- Feature engineering normalizes ranges and avoids leakage via time-aware splits in training.
Understanding the Setup Rating (1–10)
- The rating reflects how closely the current fingerprint resembles historically favorable fingerprints in our backtests.
- Higher scores generally corresponded to higher historical hit rates in backtested data; this does not imply future performance.
- Use the score alongside risk controls, trend context, and your own judgment.
Training the Model
The model is trained on thousands of trade snapshots produced by our research/backtesting pipeline. We use time-based splits and holdouts to evaluate generalization on later periods.
- Records include entry date, engineered features, and labeled outcomes used for training evaluation.
- Metrics are monitored on future holdouts to assess stability and drift.
Results are for research and model monitoring; they are not individualized advice.
Why It’s Useful in Research
- Data-driven context instead of fixed heuristics.
- Supports nuanced combinations of technical indicators.
- Provides a consistent, human-readable score for quick triage.